- Research
- Open access
- Published:
Exhaled volatile organic compounds as novel biomarkers for early detection of COPD, asthma, and PRISm: a cross-sectional study
Respiratory Research volume 26, Article number: 173 (2025)
Abstract
Background
Globally, chronic respiratory diseases have become the third leading cause of death, including chronic obstructive pulmonary disease (COPD) and asthma, and have been threatening human life for a long time. To alleviate the disease burden, it is crucial to develop rapid and convenient screening methods for COPD, preserved ratio impaired spirometry (PRISm), and asthma. Volatile organic compounds (VOCs) in breath can reflect the pathophysiological processes of disease, thereby having the potential to serve as a promising approach for diagnosing respiratory diseases. Can we identify VOC markers in breath with the potential to serve as classification indicators, and further establish learning models for the early detection of COPD, asthma, or PRISm patients?
Methods
This is a cross-sectional study in which exhaled breath samples were collected from 184 patients with COPD, 66 patients with asthma, 72 PRISm individuals, and 45 healthy individuals. From August 2023 to June 2024, the breath samples were analyzed using portable micro gas chromatography (CXBA-Alpha, ChromX Health Co., Ltd.). Potential VOC markers for classification were identified by univariate and multivariate analyses. Subsequently, classification models were established by machine learning algorithms, based on these VOC markers along with baseline characteristics. The sensitivity, specificity, and accuracy of these models were calculated to assess their overall discriminatory performance.
Results
A total of 367 patients were enrolled in our study. We identified nine VOCs distinguishing COPD patients from healthy controls, nine VOCs differentiating the PRISm population from healthy controls, five VOCs separating asthma patients from healthy controls, five VOCs distinguishing COPD patients from asthma patients, and seven VOCs differentiating the PRISm population from asthma patients based on breathomics feature selection. We utilized five algorithms to establish diagnostic models and selected the optimal one among them. The random forest model best distinguished COPD from healthy controls with an area under the receiver operating characteristic curve (AUC) of 0.92 ± 0.01. The support vector classifier (SVC) model was most effective in separating PRISm from healthy controls, achieving an AUC of 0.78 ± 0.01. Logistic regression performed well in discriminating asthma from PRISm (AUC, 0.74 ± 0.02) and COPD (AUC, 0.92 ± 0.01), in contrast, the random forest model differentiated asthma from healthy controls with an AUC of 0.81 ± 0.02.
Conclusion
VOC panel-based classification models have the potential to be a novel strategy for the discrimination of chronic respiratory diseases. Using the portal micro gas chromatography enables swift detection of chronic respiratory disease and, most importantly, facilitates the rapid identification of PRISm individuals within the population.
Highlights
1. We have identified a group of volatile organic compounds present in exhaled breath that can be used to distinguish between patients with COPD, asthma, PRISm individuals, and health individuals.
2. This study pioneers a breathomics-based rapid identification method for PRISm individuals, offering a novel strategy for early detection and management of pre-chronic obstructive pulmonary disease.
Introduction
As the third leading cause of death in the world, chronic respiratory diseases have been threatening human life for a long time [1]. Chronic obstructive pulmonary disease (COPD) and asthma are two common chronic respiratory diseases. COPD poses a significant global health challenge and imposes a substantial macroeconomic burden worldwide. Based on data provided by the Global Initiative for Chronic Obstructive Lung Disease (GOLD) 2025, the global prevalence of COPD is 10.3% (GOLD2025). By 2050, the number of COPD patients will reach 600 million [2]. Asthma impacts up to 262 million individuals globally [3]. What’s more, asthma persists as a prominent contributor to the global economic burden, encompassing both direct and indirect expenses [3]. Primarily affecting the lungs, both asthma and COPD have similar symptoms, including breathlessness, coughing, and the production of sputum. Also, numerous studies have demonstrated that both asthma and COPD are multisystemic diseases. By 2060, chronic respiratory diseases and related conditions will cause more than 5.4 million annual deaths [2]. Due to the non-specific nature of the clinical manifestations of chronic respiratory disease, many patients with COPD and asthma remain undiagnosed, leading to an underestimation of the global health burden posed by these conditions [4,5,6]. According to GOLD 2025 and Global Initiative for Asthma (GINA) 2024, pulmonary function testing remains the major diagnostic criteria for COPD and asthma. However, this diagnostic method is time-consuming. Usually, it takes approximately 30 min for each patient to complete a full set of lung function tests. What’s more, the results of pulmonary function testing are highly dependent on patients’ condition and level of cooperation. Patients with extremely severe COPD are often unable to complete the pulmonary function test according to the standard operation due to their critical condition, resulting in the generation of inaccurate lung function report. Therefore, developing a rapid, accurate, and convenient diagnostic method is important for alleviating the burden imposed by COPD and asthma.
Preserved ratio impaired spirometry (PRISm) denotes non-obstructive pulmonary function abnormalities characterized by a normal forced expiratory volume in the first second (FEV1)/ forced vital capacity (FVC) ratio but a reduced FEV1 [7]. PRISm can be considered as an early stage of COPD. Globally, approximately 22.2%-35.8% of individuals with PRISm will eventually progress to COPD [8]. Although the progression of PRISm is unpredictable, extensive research has indicated that PRISm is significantly related to increased incidence of COPD complications and all-cause mortality [9,10,11]. Therefore, early screening and long-term follow-up of the PRISm population represent an effective strategy to reduce the incidence rate of COPD.
Exhaled breath analysis through volatile organic compounds (VOC) is an emerging non-invasive method for the differential diagnosis of diseases, particularly respiratory diseases [12,13,14]. VOCs are broadly categorized into endogenous and exogenous sources. Exogenous VOCs predominantly originate from molecules introduced via the oral cavity and gastrointestinal tract, including residual food and beverages, salivary components, and microbial metabolites derived from oral or gut microbiota [15]. What’s more, occupational exposure can also affect the types of exogenous VOCs detected [16]. Additionally, occupational exposure represents a critical determinant of exogenous VOC profiles. For instance, xylene—a well-documented environmental pollutant—has been detected in exhaled breath samples, with its concentration positively correlated with occupational histories involving painting, printing, petroleum refining, gasoline handling, or laboratory procedures requiring solvent use [17].
Endogenous VOCs in exhaled breath are generated by various metabolic processes within the human body and reach the alveoli via blood-gas exchange [18]. Consequently, alterations in exhaled VOCs can reflect different pathophysiological conditions of patients [19]. Currently, common techniques for detecting exhaled VOCs include gas chromatography-mass spectrometry (GC–MS), proton transfer reaction mass spectrometry (PTR-MS), and electronic noses (eNose) [20,21,22]. What’s more, some new methods include exhaled breath condensate (EBC) is now used for detecting H2O2 and other exhaled breath parameters for use as a diagnostic tool [23]. Previous research has indicated that exhaled VOCs hold the potential to serve as effective biomarkers for diagnosing various respiratory diseases, including COPD, lung cancer, asthma, and COVID-19 [24]. Exhaled VOC can not only facilitate the diagnosis of different diseases but also effectively reflect the severity and phenotypes [25]. However, there are limited studies on the differentiation of various chronic respiratory diseases, and the results are often controversial. Furthermore, to date, no research has been conducted on the recognition of PRISm.
Previously we have developed a portable micro gas chromatography (micro GC) device for diagnosing and monitoring COVID-19, colorectal cancer, acute respiratory distress syndrome (ARDS), etc., based on exhaled breath analysis [26,27,28,29,30,31]. These studies suggest that breath analysis holds significant promise as a non-invasive, rapid, and potentially accurate diagnostic tool for various medical conditions. However, limited research has been conducted on differentiating between patients with COPD, asthma, PRISm, and healthy individuals using VOCs, and the feasibility of distinguishing among these groups remains uncertain.
Given the growing emphasis on improving the grassroots screening capacity for chronic respiratory diseases, rapid screening tests for distinguishing COPD and asthma patients, as well as PRISm individuals from healthy individuals, are of paramount importance. In this study, we aim to utilize a non-invasive breathomics test to identify VOC markers for the discrimination of chronic respiratory disease and subsequently develop models using machine learning for the early detection of PRISm, COPD, and asthma patients (Figure S1).
Method
Study participants
Individuals diagnosed with COPD, asthma, or PRISm by respiratory physicians at Ruijin Hospital were recruited at the respiratory function test room between August 2023 and June 2024 to investigate potential differences among various chronic respiratory diseases. Simultaneously, healthy controls, defined as individuals with normal pulmonary function, were enrolled during the same period. Informed consents were obtained from each participant. Anonymous analysis was subsequently conducted to protect patient privacy.
Demographic characteristics collection
Demographic information, clinical manifestations, underlying disease, and the results of pulmonary functional tests were collected using a smartphone application. The demographic information included age, sex, smoking condition, and occupational exposure to smoke. Clinical manifestations included respiratory symptoms (such as cough, sputum, dyspnea, hemoptysis, and acute exacerbations of COPD, if applicable), scales related to COPD, and medication status. Information on common underlying diseases associated with COPD, such as cardiovascular abnormalities, digestive system disease, and cerebrovascular disease, was also collected. All participants completed the pulmonary functional test. Indicators including forced expiratory volume in the first second (FEV1%), FEV1/FVC, inspiratory Capacity (IC), maximum expiratory flow 50 (MEF50), MEF75, and maximal mid-expiratory flow 75/25 (MMEF75/25) were recorded. Besides, vital signs, including heart rate and blood pressure, were also measured using a portable blood pressure monitor.
Exhaled sample collection
For enrolled participants, VOCs were collected from each individual after they had cleaned their oral cavity. The subjects remained at rest while providing the exhaled sample. Under the guidance of doctors, the subjects’ mouths were covered with an exhalation mask. They inhaled normally through the nose and exhaled slowly through the mouth for 3 min. Exhaled samples were directly injected into the gas inlet for field VOC analysis and automatically analyzed in real-time using a portable Micro Gas Chromatography (micro GC) device (CXBA-Alpha, ChromX Health Co., Ltd.). To ensure the integrity of subsequent samples, a nitrogen flush was performed between patient samples. This procedure purges any residual VOCs from the system, thereby preventing cross-contamination. Concurrently, an additional 3-min breath sample was collected using a thermal desorber tube pre-processed with 99.99% nitrogen, which was connected to a micro GC-mass spectrometry device (MSD) for further VOC identification [32]. The thermal desorber contained carbopack X and carbopack B, which adsorb VOCs at room temperature and desorb VOCs at high temperatures.
μGC detection
The working principle of portable gas chromatography has been extensively described in previous studies [26,27,28,29,30,31]. Briefly, the micro GC system consists of three distinct silicon-based microfabricated chips: a multi-adsorbent packed micropreconcentrator-injector (μPCI) for VOC capture, preconcentration, and injection; a 10 m long microcolumn integrated with thin-metal heaters and temperature sensors for temperature-programmed separations; and a microfabricated helium discharge photoionization detector [32]. To separate the volatile organic compounds (VOCs) in the exhaled breath samples, we used a micro-GC system. The micro-GC component performs the separation based on the volatility of the compounds. Following separation, compounds are detected and identified using a mass spectrometry device (MSD), which analyzes the mass-to-charge ratio (m/z) of individual compounds. This tandem combination of micro-GC and MSD enables both the separation and precise identification of VOCs. To optimize the analysis process and reduce detection load, only 20% of the total samples were analyzed using mass spectrometry. This sampling approach was chosen to balance the need for high-quality compound identification while managing the resource and time constraints of the study. During a full analysis cycle, 600 ml of the breath sample was directly drawn through a Nafion tube to remove moisture, then through the μPCI at a fixed flow rate of 200 ml per minute using a mini pump. The captured VOCs were subsequently injected into a microcolumn by rapid thermal desorption (~ 300 ms). Within the column, the VOC mixture was separated under conditions of a 1 mL/min carrier gas flow rate and a temperature program with a ramp rate of 10°C/min from 25°C to 180°C [29].
Additionally, 20% of the exhaled samples were also collected using a thermal desorber tube (TD 100-xr, MARKES), which was connected to a micro GC-mass spectrometry device (MSD) for further VOC identification. This comprehensive platform comprises a high through put automatic injector, a homemade thermal desorber, a μGC-μPID, and an MSD (Agilent 5977B). The tube undergoes thermal desorption under standard settings: a flow path at 180 °C, and a pre-purge at 100 mL/min for 2 min to remove water moisture. The sample tube was desorbed at 300 °C for 10 min, with the flow rates set at 60 mL/min. Mass spectra were obtained using Qualitative Analysis 10.0 (MassHunter) software and cross-referenced with the NIST 2017, Version 2.3 mass spectrum library.
To ensure the quality of each sample, environment monitoring and quality control procedures were conducted weekly. Each sample was monitored in the background, and any substandard samples were discarded. The device performed automatic self-cleaning after each sampling session.
Data preprocessing
To minimize the impact of system noise and detection errors, raw chromatograms underwent sequential preprocessing steps. These included spike removal, baseline correction, noise reduction, and retention time alignment. The data were then manually inspected, and samples with detection failures were excluded. A derivative-based peak quantification algorithm was applied to identify VOC peaks and calculate the area under the peak. The results were organized into a matrix, with each column corresponding to the retention time of a specific VOC peak. Normalization was conducted to allow for semi-quantitative analysis across samples with varying concentration levels. Notably, VOCs or samples with a low response rate were excluded from further analysis due to the sample size requirements of statistical tests.
Data analysis
Dataset
The dataset included variables such as COPD, asthma, PRISm, and healthy individuals for analysis. The dataset was randomly split into two subsets: a discovery set, comprising 70% of the total dataset, used for biomarker discovery and model training; and a test set, accounting for 30% of the total dataset, reserved exclusively for model evaluation. To address the class imbalance in the dataset, we employed a combination of strategies to ensure reliable model performance: 1. Stratified data splitting: we used stratified splitting during data partitioning to preserve the class distribution across the training, validation, and test sets, ensuring that each set represented the original label proportions. 2. Tree-based algorithms: we chose tree-based machine learning algorithms, such as random forest and XGBoost, which are known to be less sensitive to class imbalances due to their built-in mechanisms for handling such disparities. 3. Class weight adjustment: in models that allow for class weight modifications (e.g., logistic regression), we adjusted the class weights to compensate for the imbalance, assigning higher weights to the minority classes to improve model sensitivity.
By combining these approaches, we mitigated the effects of class imbalance while maintaining model generalizability and avoiding the risks associated with oversampling methods.
Biomarker discovery
A series of statistical tests were performed to identify potential VOC markers. The Mann–Whitney U test was used for univariate analysis, and false discovery rate (FDR) correction was applied to account for multiple comparisons. A significance threshold of p < 0.05 was set to determine statistical significance. For multivariate analysis, features with a variable importance in projection (VIP) score greater than 1 were selected using Orthogonal Partial Least Squares Discriminant Analysis (OPLS-DA). This approach allowed for the identification of variables that significantly contributed to classification. Given the limitations related to sample size and distribution, the screening criteria were adjusted to enhance the robustness and reliability of the findings.
Modeling and evaluation
A combined dataset of VOC biomarkers and clinical information (including gender, age, BMI, smoking status, and occupational exposure) was extracted from the original feature dataset. The following models were selected for this study: logistic regression, support vector machine (SVM), Random Forest, eXtreme Gradient Boosting (XGBoost), and K-Nearest Neighbor (KNN). Optimal hyperparameters for each model were determined using five-fold cross-validation on the discovery set. These models were then trained on the entire discovery set. The performances of the trained models were evaluated on the test set using metrics such as F1 score, accuracy, sensitivity, specificity, and the area under the receiver operating characteristic (ROC-AUC) curve. To ensure a robust assessment of overall performance, confidence intervals were calculated based on 30 repeated samplings of the discovery and test sets.
Statistics analysis
Demographic characteristics and clinical information were compared between different groups using t-tests for continuous variables and Chi-Square tests for categorical data. All other analyses were conducted using SPSS software (version 26, IBM ©). All steps of the analysis, including chromatogram data preprocessing, VOC biomarker selection, clinical information statistics, and machine learning modeling, were performed using Python software (version 3.9.18).
Result
Demographic characteristics
We recruited 474 individuals from Ruijin Hospital, Shanghai Jiao Tong University from August 2023 to June 2024. A total of 367 participants (111 female and 256 male) were enrolled after quality control exclusions. Among these samples, 184 (51.3%) patients were diagnosed with COPD, 72 (20.1%) with PRISm, 66 (18.0%) with asthma, and 45 (12.5%) were classified as healthy individuals (Fig. 1). The age of all participants was from 11 to 88 years. Compared with the healthy group, COPD patients and PRISm patients had a higher rate of smoking (22.3% vs 26.4% vs 20%, P < 0.01) and a more severe smoking habit (P < 0.01). A total of 204 patients (55.6%) reported having underlying disease. Cardiovascular disease was the most common comorbidity, particularly in COPD and PRISm groups, at 33.7% and 50% respectively. Regarding the pulmonary functional test, both obstructive pulmonary ventilation dysfunction and small airway obstruction were significantly more severe in the COPD group than in the other groups (P < 0.01). The baseline characteristics of the study population are shown in Table 1.

Flowchart for the study
For patients diagnosed with COPD, we further analyzed the severity and clinical manifestations of the disease. Among all COPD patients, 70 (38.0%) were classified as having mild or moderate COPD (GOLD stages I and II), while 105 were diagnosed with severe or extremely severe COPD (GOLD stages III and IV). There was no statistically significant difference in demographic characteristics between these two groups. Regarding clinical manifestations, we utilized both the COPD Assessment Test (CAT) and the British Medical Research Council (MRC) dyspnea scale. The average CAT score in the COPD group was 11.6, and the average MRC score was 2.5.
Characteristic VOCs between different group
Univariate and multivariate analyses revealed that three VOC signatures (VOC@464.830, VOC@521.740, VOC@537.162) were significantly increased in concentration among COPD patients compared to healthy controls. Conversely, six signatures (VOC@531.953, VOC@691.343, VOC@762.87, VOC@815.632, VOC@910.533, VOC@916.565) were significantly decreased in the COPD group. Qualitative analysis confirmed the chemical formula of 6 out of the 9 VOCs, including Acetone (VOC@464.830), Cyclopentane (VOC@521.740), Tetrachloroethylene (VOC@537.162), p-Xylene (VOC@680.489), Nonane (VOC@762.870), Decane (VOC@815.632), Limonene (VOC@828.336), and Undecane (VOC@910.533). The results of VOC markers distinguishing the COPD group and healthy controls are shown in Table S1, and the violin plot is shown in Fig. 2a. We then compared these nine signatures with differential demographic characteristics. Our finding indicated no significant correlation between the 9 VOCs and the differential demographic characteristics. A heatmap depicting this correlation is displayed in Fig. 3.
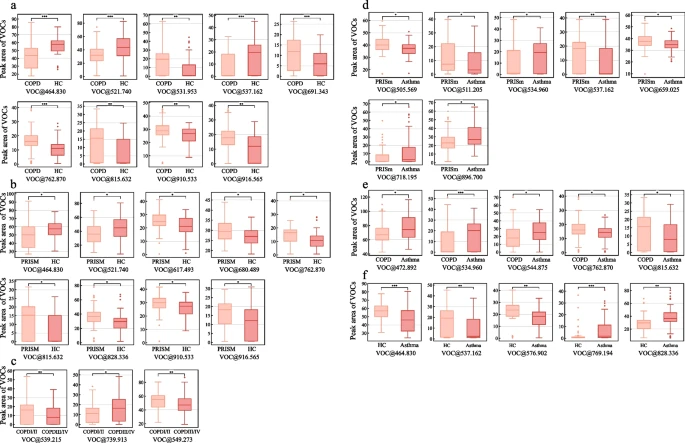
The relative concentration of the signature VOCs between different groups. a The relative concentration of the 9 VOCs between COPD group and healthy controls. b The relative concentration of the 9 VOCs between PRISm group and healthy controls. c The relative concentration of the 3 VOCs between mild/moderate COPD group and severe/extremely severe COPD group. d The relative concentration of the 7 VOCs between asthma group and PRISm group. e The relative concentration of the 6 VOCs between asthma group and COPD group. f The relative concentration of the 5 VOCs between asthma group and healthy controls

Heat map of correlation between VOC markers and demographic characteristics
We applied the same analytical approach to identify VOC signatures specific to the PRISm group. Our analysis revealed that nine signatures were significantly different in concentration in the PRISm population compared to the healthy controls. These nine VOC markers were identical to those found in the COPD group, although the direction of change for some markers differed. Specifically, while p-Xylene was significantly decreased in the COPD group (fold change = 0.03), it showed an increase in the PRISm group. Detailed information on these VOC markers is provided in Table S2, and the corresponding violin plot is presented in Fig. 2b.
To further investigate the impact of disease severity on exhaled molecules, we compared VOCs between patients with mild/moderate COPD and those with severe/ extremely severe COPD. Since the statistical analysis-based screening method did not yield statistically significant signatures, we employed a machine learning approach – Extra Trees – for this screening. The result showed that 3 molecules (VOC@539.215, VOC@739.913, VOC@549.273) were statistically significant in distinguishing between mild/moderate COPD patients and severe/extremely severe COPD patients (P < 0.05) (Fig. 2c, Table S3).
Regarding asthma patients, seven molecules were identified as statistically significant in distinguishing between the asthma and PRISm group. This included three increased molecules (VOC@534.960, VOC@718.195, VOC@896.700) and four decreased molecules (VOC@505.569, VOC@511.205, VOC@537.162, VOC@659.025). Qualitative analysis also identified the chemical formulas for some of these VOCs, specifically, 2-Ethyl-oxetane (VOC@505.569), Furan (VOC@511.205), and Benzene (VOC@537.162) (Fig. 2d, Table S4).
We further compared the asthma group with both the COPD group and the healthy control group. The result indicated that six VOCs (VOC@472.892, VOC@534.960, VOC@544.875, VOC@634.346, VOC@762.870, VOC@815.632) were able to differentiate asthma from COPD. In addition, five VOCs (VOC@464.830, VOC@537.162, VOC@576.902, VOC@769.194, VOC@828.336) could differentiate asthma from the healthy control group (Fig. 2e-f, Table S5-6).
Classification models based on VOCs
Utilizing the VOC markers we had identified previously, in conjunction with baseline characteristics, we constructed five models using five different machine learning methods to differentiate between various groups. Subsequently, we assessed the effectiveness of these classification models by generating ROC curves and calculating AUC values. Five models were constructed using five popular methods. The optimal model was selected based on the highest AUC value. The performance of five models is illustrated in Table 2.
For the differentiation between the COPD group and healthy controls, the Random Forest model outperformed the other models, achieving an AUC of 0.92±0.01. The best specificity achieved was 85% and the best sensitivity achieved was 90%. Upon incorporating demographic characteristics, the model’s performance improved marginally, reaching an AUC of 0.92±0.01, with 91% of specificity and 84% of sensitivity (Figure 4a). We follow the same procedure to create a classification model for distinguishing the PRISm group from healthy controls. The SVC model demonstrated the highest efficiency in this case, with an AUC of 0.78±0.01 as well as specificity of 69% (Figure 4b), and notably, its best sensitivity reached 87%. Additionally, we constructed discrimination models for asthma versus PRISm. The logistic regression model for this comparison achieved an AUC of 0.74±0.02, with a specificity of 82% and sensitivity of 66% (Figure 4c). We also developed classification models for differentiating between asthma and COPD, as well as between asthma and healthy controls. Both models exhibited excellent performances, achieving AUCs of 0.92±0.01 with a specificity of 85% and sensitivity of 92% for the differentiation of asthma from COPD using the logistic regression model, and 0.81±0.02 with a specificity of 80% and sensitivity of 79% for distinguishing asthma from healthy controls using the Random Forest model, respectively (Figure 4d-e).

ROCs of the classification models. a The ROC curves of the classification models between COPD group and healthy controls. b The ROC curves of the classification models between PRISm group and healthy controls. c The ROC curves of the classification models between asthma group and PRISm group. d The ROC curves of the classification models between asthma group and COPD group. e The ROC curves of the classification models between asthma group and healthy controls
Discussion
To our knowledge, this is the first study to investigate the differential exhaled VOCs between COPD, PRISm, asthma, and other chronic respiratory diseases using portal micro gas chromatography. Remarkably, we further developed classification models based on exhaled VOCs and demographic characteristics through machine learning. We highlight here that exhaled VOCs can effectively discriminate between patients with COPD, PRISm, or other chronic respiratory diseases and health control. Additionally, we demonstrated that classification models conducted by machine learning have the potential to enable quick and efficient screening for PRISm. Although other research has also established diagnostic models for chronic respiratory diseases, our classification models exhibited high efficiency (Table S7).
At present, common devices for analyzing exhale metabolism include GC–MS, PTR-MS, eNose, etc. However, these detection methods are limited by their complexity, high cost, inconvenience, and lengthy examination times. Other omics approaches, such as plasma metabolomics, are popular but also have limitations, including being expensive and inconvenient [33]. In the present study, we employed a highly portable device that operates in real-time and provides point-of-care testing, enabling the simultaneous collection and analysis of exhaled samples. The results obtained from our devices were similar, and all models demonstrated high classification performance.
Previous studies have already demonstrated that exhaled VOCs can distinguish between COPD patients and health subjects [34, 35]. The feature VOCs discovered in previous research ranged from 5 to 43, which were not exactly consistent [34,35,36]. Our research also identified nine compounds to distinguish COPD patients from healthy individuals. Some of the identified compounds were also identified previously, including nonanal, decane, acetone, and undecane [35, 37,38,39,40]. We also identified some VOCs that showed originality in the compounds identified compared to previous studies, including limonene. Limonene significantly increases in the exhaled breath of patients with COPD and is considered to be associated with airway inflammation and obstruction [41]. Previous studies demonstrated that the use of limonene-contained capsules or drug can attenuate airway inflammation and obstruction in chronic bronchitis and acute lung injury animal models. The specific mechanism may related to TLR4 signaling inhibition and NF-κB activation [41, 42]. Diagnostic models were also established in the previous study. However, the effectiveness of these models was not high. The reason may be related to the small sizes of these studies, the influence of different baseline characteristics, or algorithmic inadequacies [35, 37]. To improve the efficiency of our models, we enrolled more than one hundred COPD patients. Besides, machine learning was performed during model establishment and a training set was used to fit the optimal parameters for our model. What’s more, 30 times random sampling was performed to validate and adjust our model. All these efforts significantly increased the efficiency of our model, with an AUC of more than 0.9.
Although our study did not find significant correlations between the nine VOCs and demographic characteristics (e.g., age, gender), this does not imply that these VOCs are unrelated to respiratory diseases. Rather, it suggests that the VOCs identified are not demographic-specific but may be more closely linked to disease pathology itself. This supports the idea that VOCs are more strongly associated with the disease process than with demographic factors. Further research is needed to confirm the potential role of these VOCs as disease biomarkers, independent of demographic influences.
Interestingly, our work also identified 9 VOCs that can differentiate PRISm and health controls. These 5 of 9 VOCs were highly coincided with those found in COPD, although the tendency was not exactly the same. Compared with healthy controls, p-Xylene was significantly decreased in the COPD group but increased in the PRISm group, suggesting its potential association with the occurrence of the disease. At present, there is little research related to this molecular and respiratory disease. A previous study had demonstrated that p-Xylene may related to the shorter leukocyte telomere length in human and therefore associated with molecular aging [43]. Considering the close relationship between COPD and molecular aging, the relationship between p-Xylene and COPD should be a focus of future studies. Some research also showed that its isomer, M-p-Xylene, has a significant nonlinear relationship with the incidence of COPD [44]. What’s more, previous research has also proved that the predicated model based on the concentration of M-p-Xylene in blood was related to the age at onset of chronic respiratory disease [45]. Furthermore, until now, the specific role of p-Xylene remains to be further studied. Additionally, we also identified acetone among these 9 signatures, which was previously reported to be exhalation flow-dependent [46]. Prior research has demonstrated that exhaled acetone levels increase with higher expiratory flow rates and the level of acetone had been used for measurement of disease severity in acute respiratory disease syndrome [46, 47]. Consequently, the decreased level of acetone in the PRISm groups indicated that a reduced expiratory flow may occur in PRISm. Notably, research on the role of acetone in reflecting airway obstruction remains limited. Given that acetone serves as a biomarker of energy metabolism status, its correlation with airway obstruction requires further investigation to elucidate underlying pathophysiological mechanisms.
Regarding the classification mode, the AUC of the model we established is 0.77. It is worth noting that the sensitivity of our classification mode reached 0.82, suggesting the potential of this model as a screening method. The relatively low AUC for distinguishing PRISm from healthy controls, may limit the immediate utility of VOC-based testing as a standalone screening tool for this specific disease. The modest performance can be attributed to several factors, including the subtle and heterogeneous nature of PRISm, which presents challenges in distinguishing it from healthy controls using exhaled breath VOCs alone. Additionally, the relatively small sample size and the focus on a specific patient cohort may have impacted the model's ability to generalize across different populations. Given the exploratory nature of this study, future research should focus on refining the feature selection process and incorporating larger, more diverse datasets to improve model performance. Furthermore, combining VOC analysis with other diagnostic methods may enhance its sensitivity and specificity for detecting PRISm in clinical practice. As the field of breath-based diagnostics continues to evolve, further optimization of VOC-based models could lead to more reliable tools for early detection and disease differentiation.
We also discovered a couple of compounds that can distinguish asthma patients from those with COPD and PRISm. In terms of signatures differentiating asthma from COPD patients, we identified another exhalation flow-dependent compound – pentane. This finding suggests that the mechanism of airway obstruction may differ between these two respiratory diseases. What’s more, in our research, we found furan to be distinctive between the asthma group and the PRISm group. Previous studies have shown that this molecule can induce the redox imbalance, genomic instability, and inflammation pathway in the lung [48]. Our result showed that, compared to the PRISm group, the level of this compound was decreased in the asthma group. This suggests that, in addition to pulmonary functional impairment, PRISm may also involve other structural and genetic changes.
It should be noted that our result demonstrated distinct patterns in mid-to-small airway function across study groups, as evidenced by MEF50 and MEF75 measurements. COPD patients exhibited the lowest MEF50 and MEF75 values, consistent with severe small airway obstruction—a pathophysiological hallmark of COPD characterized by progressive distal airway remodeling. Meanwhile, PRISm and asthma group also present mild to moderate small airway obstruction, which is in line with previous studies. There are significant differences among the three groups in terms of the degree of small airway obstruction. Therefore, the VOC-based machine learning models we have established can, in a certain sense, also effectively distinguish the degree of small airway obstruction.
Pulmonary function testing (PFT) remains the gold standard for diagnosing chronic respiratory diseases. However, its application in primary care settings is often limited by several challenges, including a lack of trained personnel, insufficient access to proper equipment, and poor patient cooperation. In this context, our non-invasive portable micro-GC device emerges as a promising alternative for implementation in primary care. The micro-GC requires minimal training for both physicians and patients, ensuring ease of operation and high patient compliance. Based on our clinical experience, patients have demonstrated excellent cooperation, enabling the entire testing process to be conducted smoothly. Additionally, the compact size of the micro-GC makes it particularly suitable for primary care facilities with limited space. Given the critical role of screening for chronic respiratory diseases in primary and community hospitals, the micro-GC can serve as an efficient triage tool to identify high-risk individuals who may require further spirometry or specialist referral. By establishing simplified panels of key VOCs associated with PRISm, COPD, and asthma, large-scale screening initiatives can be implemented to reduce diagnostic delays, particularly in regions with limited access to conventional pulmonary function testing. Considering its operational simplicity and convenience, the micro-GC represents a promising tool for the early screening of chronic respiratory diseases, especially in resource-constrained primary care settings.
While our study provides important insights into the diagnostic potential of exhaled breath for detecting pulmonary diseases, a limitation is the incomplete chemical identification of some VOCs. The untargeted nature of the analysis, combined with the inherent challenges of mass spectrometry in detecting low-abundance VOCs and distinguishing them from noise interference, contributed to the lack of confirmation for some markers. Despite this, the presence of these unidentified VOCs may still have biological significance, as they could be involved in disease-specific metabolic pathways or inflammatory processes. Further research focusing on the qualitative identification and biological relevance of these VOCs is essential to fully understand their role in pulmonary disease diagnosis. In future studies, more advanced techniques such as high-resolution mass spectrometry or complementary analytical methods could help improve the identification and characterization of these markers, offering deeper insights into the potential biomarkers of disease.
It's worth noting that, the study is the individualized hyperparameter tuning applied to each disease differentiation model. While this strategy was employed to optimize the detection performance of the biomarkers for each specific disease (COPD, Asthma, PRISm), it may introduce variability across the models, complicating direct comparisons. Moreover, the use of distinct hyperparameters for each dataset could lead to increased computational cost and a higher risk of overfitting, as models may become overly tailored to the idiosyncrasies of each dataset rather than capturing more generalizable patterns. Future work could consider exploring cross-validation techniques or a more consistent hyperparameter optimization approach to reduce these potential issues and improve model robustness across different clinical contexts.
It is crucial to acknowledge the limitations of this study. Firstly, although the research scale of our study is larger than most previous studies, the number of participants remains insufficient, leading to the performance of some classification models being less than satisfactory. Thus, further studies with a larger population are necessary to evaluate and refine our classification models and hopefully, independent validation can be fulfilled in future studies. Secondly, the relatively short duration of the research period limited our follow-up with the PRISm group, preventing us from fully assessing the predicted value of VOCs we identified. Despite establishing classification models for COPD, asthma, and PRISm, ongoing follow-up is essential to evaluate the predicting value of identified VOCs and related predicting models. Thirdly, exhaled VOCs are susceptible to artifacts from gastrointestinal gas. Attempts to reduce the effects of this limitation were made by asking patients to fast for two hours. What’s more, although the detection range of micro GC is not as extensive as that of GC–MS, it compensates with its exceptional speed and portability. Micro GC is particularly advantageous for rapid on-site analysis and real-time monitoring. Lastly, consistent with the epidemiological profile of COPD, the enrolled participants demonstrated imbalances in age and gender distribution, which may limit the generalizability of our findings to younger or female populations. Further studies will be conducted with stratified sampling to balance age and gender distribution. Despite these limitations, we would like to emphasize the potential roles of VOCs in the diagnosis of chronic respiratory disease, as well as in the early screening of the PRISm population.
Conclusion
In conclusion, we have identified several potential VOC markers related to COPD, PRISm, and asthma. The classification models based on these VOCs and baseline characteristics showed good-to-excellent performance in distinguishing between different groups. This study suggests that the VOC panel-based classification model holds potential as a novel strategy for chronic respiratory diagnosis and, more importantly, for the rapid identification of PRISm individuals within the population.
Data availability
No datasets were generated or analysed during the current study.
References
Collaborators GBDCRD. Prevalence and attributable health burden of chronic respiratory diseases, 1990–2017: a systematic analysis for the Global Burden of Disease Study 2017. Lancet Respir Med. 2020;8(6):585–96. https://doiorg.publicaciones.saludcastillayleon.es/10.1016/S2213-2600(20)30105-3.
Global Initiative for Chronic Obstructive Lung Disease (GOLD) 2025.
The Global Asthma Report 2022. Int J Tuberc Lung Dis. Nov 25 2022;26(Supp 1):1–104. https://doiorg.publicaciones.saludcastillayleon.es/10.5588/ijtld.22.1010
Aaron SD, Vandemheen KL, Whitmore GA, et al. Early diagnosis and treatment of COPD and asthma - a randomized. Controlled Trial N Engl J Med. 2024;390(22):2061–73. https://doiorg.publicaciones.saludcastillayleon.es/10.1056/NEJMoa2401389.
Colak Y, Nordestgaard BG, Vestbo J, Afzal S, Lange P. Potential clinical implications of targeted spirometry for detection of COPD: a contemporary population-based cohort study. Respir Med. 2022;197:106852. https://doiorg.publicaciones.saludcastillayleon.es/10.1016/j.rmed.2022.106852.
Chen D, Curtis JL, Chen Y. Twenty years of changes in the definition of early chronic obstructive pulmonary disease. Chin Med J Pulm Crit Care Med. 2023;1(2):84–93. https://doiorg.publicaciones.saludcastillayleon.es/10.1016/j.pccm.2023.03.004.
Han MK, Agusti A, Celli BR, et al. From GOLD 0 to Pre-COPD. Am J Respir Crit Care Med. 2021;203(4):414–23. https://doiorg.publicaciones.saludcastillayleon.es/10.1164/rccm.202008-3328PP.
Wan ES, Hokanson JE, Regan EA, et al. Significant spirometric transitions and preserved ratio impaired spirometry among ever smokers. Chest. 2022;161(3):651–61. https://doiorg.publicaciones.saludcastillayleon.es/10.1016/j.chest.2021.09.021.
Cadham CJ, Oh H, Han MK, et al. The prevalence and mortality risks of PRISm and COPD in the United States from NHANES 2007–2012. Respir Res. 2024;25(1):208. https://doiorg.publicaciones.saludcastillayleon.es/10.1186/s12931-024-02841-y.
Wan ES, Fortis S, Regan EA, et al. Longitudinal phenotypes and mortality in preserved ratio impaired spirometry in the COPDGene study. Am J Respir Crit Care Med. 2018;198(11):1397–405. https://doiorg.publicaciones.saludcastillayleon.es/10.1164/rccm.201804-0663OC.
Wijnant SRA, De Roos E, Kavousi M, et al. Trajectory and mortality of preserved ratio impaired spirometry: the Rotterdam Study. Eur Respir J. 2020;55(1):1901217. https://doiorg.publicaciones.saludcastillayleon.es/10.1183/13993003.01217-2019.
Meng S, Li Q, Zhou Z, et al. Assessment of an exhaled breath test using high-pressure photon ionization time-of-flight mass spectrometry to detect lung cancer. JAMA Netw Open. 2021;4(3):e213486. https://doiorg.publicaciones.saludcastillayleon.es/10.1001/jamanetworkopen.2021.3486.
Fu L, Wang L, Wang H, et al. A cross-sectional study: a breathomics based pulmonary tuberculosis detection method. BMC Infect Dis. 2023;23(1):148. https://doiorg.publicaciones.saludcastillayleon.es/10.1186/s12879-023-08112-3.
Zhang P, Ren T, Chen H, et al. A feasibility study of Covid-19 detection using breath analysis by high-pressure photon ionization time-of-flight mass spectrometry. J Breath Res. 2022;16(4):046009. https://doiorg.publicaciones.saludcastillayleon.es/10.1088/1752-7163/ac8ea1.
Pereira JAM, Porto-Figueira P, Taware R, Sukul P, Rapole S, Camara JS. Unravelling the potential of salivary volatile metabolites in oral diseases. A Review. Molecules. 2020;25(13):3098. https://doiorg.publicaciones.saludcastillayleon.es/10.3390/molecules25133098.
Heiro H, Trulssen Hildre T, Craster A, Grimmett L, Tardelli M, Hammarstrom B. Exploring exhaled breath volatile organic compounds in occupational asthma: A pilot cross-sectional study. J Breath Res. 2024;https://doiorg.publicaciones.saludcastillayleon.es/10.1088/1752-7163/ad7b6a
Niaz K, Bahadar H, Maqbool F, Abdollahi M. A review of environmental and occupational exposure to xylene and its health concerns. EXCLI J. 2015;14:1167–86. https://doiorg.publicaciones.saludcastillayleon.es/10.17179/excli2015-623.
van Oort PM, Povoa P, Schnabel R, et al. The potential role of exhaled breath analysis in the diagnostic process of pneumonia-a systematic review. J Breath Res. 2018;12(2):024001. https://doiorg.publicaciones.saludcastillayleon.es/10.1088/1752-7163/aaa499.
Rios-Navarro A, Gonzalez M, Carazzone C, Celis Ramirez AM. Learning about microbial language: possible interactions mediated by microbial volatile organic compounds (VOCs) and relevance to understanding Malassezia spp. metabolism. Metabolomics. 2021;17(4):39. https://doiorg.publicaciones.saludcastillayleon.es/10.1007/s11306-021-01786-3.
Mohan D, Keir HR, Richardson H, et al. Exhaled volatile organic compounds and lung microbiome in COPD: a pilot randomised controlled trial. ERJ Open Res. 2021;7(4):00253–2021. https://doiorg.publicaciones.saludcastillayleon.es/10.1183/23120541.00253-2021.
Righettoni M, Schmid A, Amann A, Pratsinis SE. Correlations between blood glucose and breath components from portable gas sensors and PTR-TOF-MS. J Breath Res. 2013;7(3):037110. https://doiorg.publicaciones.saludcastillayleon.es/10.1088/1752-7155/7/3/037110.
De Vincentis A, Pennazza G, Santonico M, et al. Breath-print analysis by e-nose may refine risk stratification for adverse outcomes in cirrhotic patients. Liver Int. 2016;37(2):242–50. https://doiorg.publicaciones.saludcastillayleon.es/10.1111/liv.13214.
Fox L, Gates J, De Vos R, et al. The VICTORY (Investigation of Inflammacheck to Measure Exhaled Breath Condensate Hydrogen Peroxide in Respiratory Conditions) study: protocol for a cross-sectional observational study. JMIR Res Protoc. 2021;10(7):e23831. https://doiorg.publicaciones.saludcastillayleon.es/10.2196/23831.
Ratiu IA, Ligor T, Bocos-Bintintan V, Mayhew CA, Buszewski B. Volatile organic compounds in exhaled breath as fingerprints of lung cancer, asthma and COPD. J Clin Med. 2020;10(1):32. https://doiorg.publicaciones.saludcastillayleon.es/10.3390/jcm10010032.
Finamore P, Pedone C, Scarlata S, et al. Validation of exhaled volatile organic compounds analysis using electronic nose as index of COPD severity. Int J Chron Obstruct Pulmon Dis. 2018;13:1441–8. https://doiorg.publicaciones.saludcastillayleon.es/10.2147/COPD.S159684.
Wang J, Nunovero N, Nidetz R, et al. Belt-mounted micro-gas-chromatograph prototype for determining personal exposures to volatile-organic-compound mixture components. Anal Chem. 2019;91(7):4747–54. https://doiorg.publicaciones.saludcastillayleon.es/10.1021/acs.analchem.9b00263.
Zang W, Liu Z, Kulkarni GS, et al. A microcolumn DC graphene sensor for rapid, sensitive, and universal chemical vapor detection. Nano Lett. 2021;21(24):10301–8. https://doiorg.publicaciones.saludcastillayleon.es/10.1021/acs.nanolett.1c03416.
Huang X, Sharma R, Sivakumar AD, Yang S, Fan X. Ultrathin silica integration for enhancing reliability of microfluidic photoionization detectors. Anal Chem. 2023;95(22):8496–504. https://doiorg.publicaciones.saludcastillayleon.es/10.1021/acs.analchem.3c00354.
Wei-Hao Li M, Ghosh A, Venkatasubramanian A, Sharma R, Huang X, Fan X. High-sensitivity micro-gas chromatograph-photoionization detector for trace vapor detection. ACS Sens. 2021;6(6):2348–55. https://doiorg.publicaciones.saludcastillayleon.es/10.1021/acssensors.1c00482.
Sharma R, Zang W, Zhou M, et al. Real time breath analysis using portable gas chromatography for adult asthma phenotypes. Metabolites. 2021;11(5):265. https://doiorg.publicaciones.saludcastillayleon.es/10.3390/metabo11050265.
Sharma R, Zang W, Tabartehfarahani A, et al. Portable breath-based volatile organic compound monitoring for the detection of COVID-19 during the circulation of the SARS-CoV-2 delta variant and the transition to the SARS-CoV-2 omicron variant. JAMA Netw Open. 2023;6(2):e230982. https://doiorg.publicaciones.saludcastillayleon.es/10.1001/jamanetworkopen.2023.0982.
Wang J, Bryant-Genevier J, Nuñovero N, et al. Compact prototype microfabricated gas chromatographic analyzer for autonomous determinations of VOC mixtures at typical workplace concentrations. Microsyst Nanoeng. 2018;4(1):1. https://doiorg.publicaciones.saludcastillayleon.es/10.1038/micronano.2017.101.
Wu W, Li Z, Wang Y, Huang C, Zhang T, Zhao H. Advances in metabolomics of chronic obstructive pulmonary disease. Chin Med J Pulm Crit Care Med. 2023;1(4):223–30. https://doiorg.publicaciones.saludcastillayleon.es/10.1016/j.pccm.2023.10.001.
Bregy L, Nussbaumer-Ochsner Y, Martinez-Lozano Sinues P, et al. Real-time mass spectrometric identification of metabolites characteristic of chronic obstructive pulmonary disease in exhaled breath. Clin Mass Spectrom. 2018;7:29–35. https://doiorg.publicaciones.saludcastillayleon.es/10.1016/j.clinms.2018.02.003.
Rodriguez-Aguilar M, Ramirez-Garcia S, Ilizaliturri-Hernandez C, et al. Ultrafast gas chromatography coupled to electronic nose to identify volatile biomarkers in exhaled breath from chronic obstructive pulmonary disease patients: a pilot study. Biomed Chromatogr. 2019;33(12):e4684. https://doiorg.publicaciones.saludcastillayleon.es/10.1002/bmc.4684.
Jareno-Esteban JJ, Munoz-Lucas MA, Gomez-Martin O, et al. Study of 5 volatile organic compounds in exhaled breath in chronic obstructive pulmonary disease. Arch Bronconeumol. 2017;53(5):251–6. https://doiorg.publicaciones.saludcastillayleon.es/10.1016/j.arbres.2016.09.003. (Estudio de 5 compuestos organicos volatiles en aire exhalado en la enfermedad pulmonar obstructiva cronica).
Van Berkel JJ, Dallinga JW, Moller GM, et al. A profile of volatile organic compounds in breath discriminates COPD patients from controls. Respir Med. 2010;104(4):557–63. https://doiorg.publicaciones.saludcastillayleon.es/10.1016/j.rmed.2009.10.018.
Basanta M, Ibrahim B, Dockry R, et al. Exhaled volatile organic compounds for phenotyping chronic obstructive pulmonary disease: a cross-sectional study. Respir Res. 2012;13(1):72. https://doiorg.publicaciones.saludcastillayleon.es/10.1186/1465-9921-13-72.
Cazzola M, Segreti A, Capuano R, et al. Analysis of exhaled breath fingerprints and volatile organic compounds in COPD. COPD Res Pract. 2015;1(1):1–8. https://doiorg.publicaciones.saludcastillayleon.es/10.1186/s40749-015-0010-1.
Martinez-Lozano Sinues P, Meier L, Berchtold C, et al. Breath analysis in real time by mass spectrometry in chronic obstructive pulmonary disease. Respiration. 2014;87(4):301–10. https://doiorg.publicaciones.saludcastillayleon.es/10.1159/000357785.
Qiu XY, Yan LS, Kang JY, et al. Eucalyptol, limonene and pinene enteric capsules attenuate airway inflammation and obstruction in lipopolysaccharide-induced chronic bronchitis rat model via TLR4 signaling inhibition. Int Immunopharmacol. 2024;129:111571. https://doiorg.publicaciones.saludcastillayleon.es/10.1016/j.intimp.2024.111571.
Yu PJ, Wan LM, Wan SH, et al. Standardized myrtol attenuates lipopolysaccharide induced acute lung injury in mice. Pharm Biol. 2016;54(12):3211–6. https://doiorg.publicaciones.saludcastillayleon.es/10.1080/13880209.2016.1216132.
Everson F, Martens DS, Nawrot TS, et al. Personal exposure to NO(2) and benzene in the Cape Town region of South Africa is associated with shorter leukocyte telomere length in women. Environ Res. 2020;182:108993. https://doiorg.publicaciones.saludcastillayleon.es/10.1016/j.envres.2019.108993.
Liu X, Chang Y, Xu C, et al. Association of volatile organic compound levels with chronic obstructive pulmonary diseases in NHANES 2013–2016. Sci Rep. 2024;14(1):16085. https://doiorg.publicaciones.saludcastillayleon.es/10.1038/s41598-024-67210-7.
Wang Y, Han X, Li J, et al. Associations between the compositional patterns of blood volatile organic compounds and chronic respiratory diseases and ages at onset in NHANES 2003–2012. Chemosphere. 2023;327:138425. https://doiorg.publicaciones.saludcastillayleon.es/10.1016/j.chemosphere.2023.138425.
Boshier PR, Priest OH, Hanna GB, Marczin N. Influence of respiratory variables on the on-line detection of exhaled trace gases by PTR-MS. Thorax. 2011;66(10):919–20. https://doiorg.publicaciones.saludcastillayleon.es/10.1136/thx.2011.161208.
Meidert AS, Chouker A, Praun S, Schelling G, Dolch ME. Exhaled breath and oxygenator sweep gas propionaldehyde in acute respiratory distress syndrome. Molecules. 2020;26(1):145. https://doiorg.publicaciones.saludcastillayleon.es/10.3390/molecules26010145.
Owumi SE, Otunla MT, Arunsi UO. A biochemical and histology experimental approach to investigate the adverse effect of chronic lead acetate and dietary furan on rat lungs. Biometals. 2023;36(1):201–16. https://doiorg.publicaciones.saludcastillayleon.es/10.1007/s10534-022-00472-8.
Acknowledgements
Throughout the study, we have received a great deal of support and assistance from Dr. Fan Pengnan and the following Projects:
1. Shanghai Municipal Key Clinical Specialty(shslczdzk02202)
2. Shanghai Top-Priority Clinical Key Disciplines Construction Project (2017ZZ02014)
3. Shanghai Key Laboratory of Emergency Prevention, Diagnosis and Treatment of Respiratory Infectious Diseases (20dz2261100)
4. Cultivation Project of Shanghai Major Infectious Disease Research Base (20dz2210500)
5. Innovative research team of high-level local universities in Shanghai
Funding
This work was supported by the Ministry of Science and Technology of the People’s Republic of China (No. 2022YFC2010005) and National Natural Science Foundation of China (No. 82070004).
Author information
Authors and Affiliations
Contributions
Jiaxin Tian and Qiurui Zhang wrote the main manuscript text and prepared figure and table (Fig. 1, Tables 1-2, table S7); Jiaxin Tian, Qiurui Zhang, Leixin Guo, Qianqian Zhao, Xuefei Liu, Simin Xie, Wenxin Wu, Yijie Li collected the breath sample and demographic data. Jiaxin Tian and Wei Lin made statistics on the data. Qiurui Zhang and Leixin Guo recruited patients. Minhua Peng, Min Zhou, Junqi Wang revised and improved the manuscript. Jin Cao, Ping Wang, Min Zhou diagnosed patients and divided the patients into appropriate groups. Minhua Peng, Wei Lin, Sitong Chen established classification models. Min Zhou, Junqi Wang provided constructive and substantial comments on the manuscript. Min Zhou initiated the study and applied for funding. All authors read and approved the final manuscript. Jiaxin Tian, Minhua Peng, Min Zhou revised manuscript and wrote point-to-point response.
Corresponding authors
Ethics declarations
Ethics approval and consent to participate
This study was approved by the Institutional Review Board of Ruijin-Hainan Hospital, Shanghai Jiaotong University School of Medicine. Information was collected from all participants after obtaining written or oral informed consent in accordance with the Declaration of Helsinki.
Consent for publication
All patients have signed informed consents and consented to publish details of their cases.
Competing interests
The authors declare no competing interests.
Additional information
Publisher’s Note
Springer Nature remains neutral with regard to jurisdictional claims in published maps and institutional affiliations.
Supplementary Information
12931_2025_3242_MOESM1_ESM.docx
Supplementary Material 1: Figure S1: Flowchart for the machine learning protocol. Table S1: Results of VOC signatures in COPD group and health control. Table S2: Results of VOC signatures in PRISm group and health control. Table S3: Results of VOC signatures in mild/moderate COPD patients and severe/ extremely severe COPD patients. Table S4: Results of VOC signatures in asthma group and PRISm group. Table S5: Results of VOC signatures in asthma group and COPD group. Table S6: Results of VOC signatures in asthma group and health control. Table S7: Accuracy of different studies on exhaled VOCs for chronic respiratory disease diagnosis.
Rights and permissions
Open Access This article is licensed under a Creative Commons Attribution-NonCommercial-NoDerivatives 4.0 International License, which permits any non-commercial use, sharing, distribution and reproduction in any medium or format, as long as you give appropriate credit to the original author(s) and the source, provide a link to the Creative Commons licence, and indicate if you modified the licensed material. You do not have permission under this licence to share adapted material derived from this article or parts of it. The images or other third party material in this article are included in the article’s Creative Commons licence, unless indicated otherwise in a credit line to the material. If material is not included in the article’s Creative Commons licence and your intended use is not permitted by statutory regulation or exceeds the permitted use, you will need to obtain permission directly from the copyright holder. To view a copy of this licence, visit http://creativecommons.org/licenses/by-nc-nd/4.0/.
About this article

Cite this article
Tian, J., Zhang, Q., Peng, M. et al. Exhaled volatile organic compounds as novel biomarkers for early detection of COPD, asthma, and PRISm: a cross-sectional study. Respir Res 26, 173 (2025). https://doiorg.publicaciones.saludcastillayleon.es/10.1186/s12931-025-03242-5
Received:
Accepted:
Published:
DOI: https://doiorg.publicaciones.saludcastillayleon.es/10.1186/s12931-025-03242-5